Claim Settlement Ratio of Life Insurance Companies in India: Complete IRDAI Data, Insurer-Wise Rankings and What It Actually Means
Claim Settlement Ratio data for FY 2024-25 reveals how India’s life insurers performed on claims payouts. IRDAI’s insurer-wise figures show wide variation across public and private players.

Claim Settlement Ratio: Which life insurers paid out claims fastest and most reliably in FY 2024-25? IRDAI's latest Claim Settlement Ratio data has the answers — and some surprises.
Claim Settlement Ratio Latest: Every year, insurance buyers are bombarded with claim settlement ratio (CSR) numbers — on comparison websites, in insurer advertisements, and in “best term insurance” listicles. Most of these numbers are quoted without saying where they came from. This article uses only one source: IRDAI’s own published data, cross-checked across three independent official documents. It shows exactly what the regulator reports, what it doesn’t, and why the “highest CSR” insurer isn’t always the one worth paying attention to.
Key Takeaways – Claim Settlement Ratio FY 2024-25 (Latest)
- The insurance industry settled 97.82% of individual life claims by number, and 96.29% by rupee value, in FY 2024-25.
- This data is not term-insurance-specific. IRDAI publishes claim settlement ratio for all individual life products combined — term, ULIP, endowment, whole life, money-back. There is no official, separate “term insurance CSR” published by the regulator.
- LIC settled 869,086 claims in FY 2024-25 alone — 84% of the entire industry’s individual claim volume. Its 97.59% ratio looks “mid-table,” but it’s not really comparable to insurers settling a few hundred or a few thousand claims a year.
- Industry-wide, only 1.01% of claims were repudiated (denied, typically for non-disclosure) and 0.66% rejected (denied for other reasons) — the vast majority of the “gap” from 100% is genuinely small.
- 97.11% of all paid claims industry-wide were settled within 30 days of intimation. A handful of insurers settle noticeably slower even when their headline CSR looks fine.
- Some insurers show a large gap between claims settled by count and by rupee value — usually traceable to a small number of large-value claims, not a broad pattern of denial.
What Is Claim Settlement Ratio (CSR)?
Claim Settlement Ratio is the proportion of death claims an insurer paid out of the total claims it was liable to settle in a financial year (claims pending from the previous year, plus claims received during the year). IRDAI requires every life insurer to report this data annually, split by:
- Number of policies — how many individual claims were settled, as a percentage of total claims.
- Benefit amount (₹) — how much of the total claimed rupee value was actually paid out.
Both are published in the Handbook on Indian Insurance Statistics, a granular, insurer-wise annual dataset — separate from IRDAI’s Annual Report, which only publishes the industry-wide aggregate.
Also Read: Third-Party Insurance: SC Extends Mandatory Cover for New Vehicles, What It Means For You
Important: This Is Not a “Term Insurance” Number
This is the single most misunderstood fact about claim settlement ratio, and it’s worth being direct about it: IRDAI does not publish a claim settlement ratio specific to term insurance. The insurer-wise figure covers all individual life insurance products sold by that company — term plans, ULIPs, endowment policies, money-back plans, and whole-life policies — combined into one number.
When you see an insurer’s website or a comparison article citing a “term plan claim settlement ratio” of, say, 99.7%, that figure is typically the insurer’s own self-reported number from an investor presentation or press release, using its own internal method of isolating term claims — not the officially published IRDAI figure. It may or may not be accurate, but it isn’t independently verifiable the way the numbers in this article are, because IRDAI itself doesn’t break the data down by product.
How Claim Settlement Ratio Is Calculated: Number vs Amount
IRDAI reports CSR two ways, and they can tell different stories:
- CSR by Count = Claims Paid (number of policies) ÷ Total Claims (number of policies). This is the number most commonly advertised, because it’s usually the higher of the two.
- CSR by Amount = Claims Paid (₹ value) ÷ Total Claims (₹ value). This weights large claims properly. An insurer can look excellent by count while settling a smaller share of the total rupee value — usually because it is slower or stricter on large claims specifically.
For a term insurance buyer — who typically holds a much larger sum assured than someone with a small endowment policy — the amount-basis ratio is arguably the more relevant number, since it reflects how insurers behave on exactly the kind of large claim a term policy would generate.
IRDAI Claim Settlement Ratio FY 2024-25 — Insurer-Wise Data (Individual Death Claims)
Sorted by CSR by count (highest first). This is all individual life business, not term insurance alone.
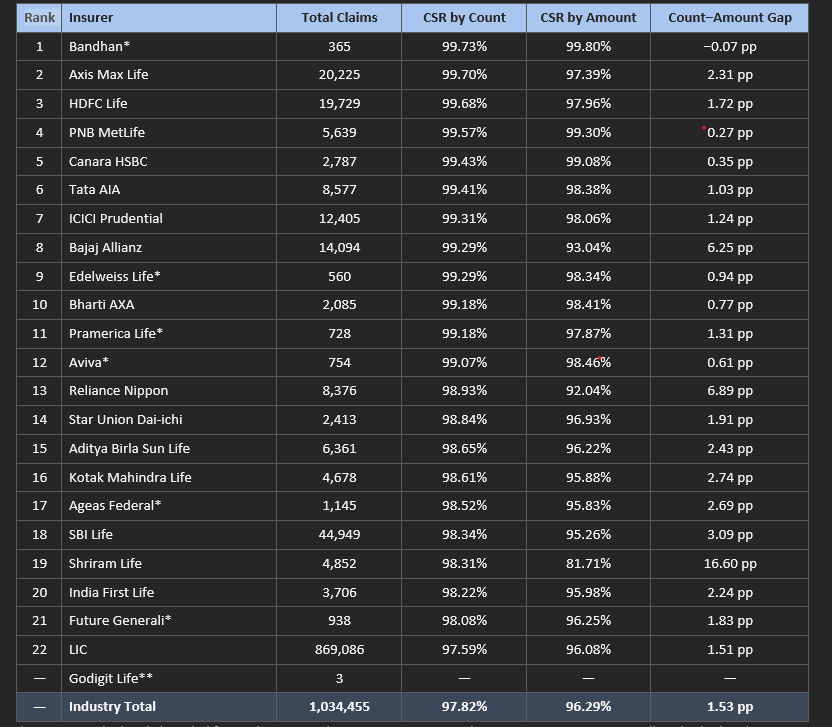
**Godigit Life had only 3 total claims in FY 2024-25, all pending — not a meaningful ratio.
Acko Life, Credit Access Life, and Sahara Life reported no individual death claims in FY 2024-25 (Sahara’s book was transferred to SBI Life by IRDAI order dated 2 June 2023) and are excluded from this table.
Claim Settlement Ratio by Amount: The Bigger Gaps Worth Knowing About
A handful of insurers show a wide gap between how many claims they settled and how much of the claimed value they actually paid:
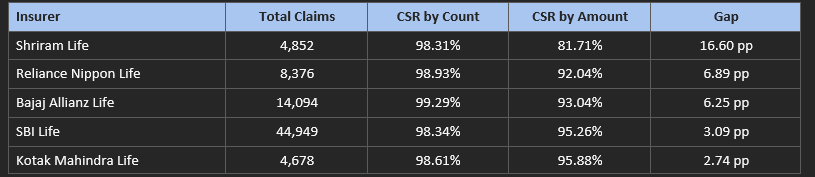
Case study — Shriram Life’s gap, explained with the underlying numbers: Shriram’s average claim size in FY 2024-25 was ₹3.72 lakh. But its 68 repudiated claims averaged ₹33.33 lakh each (roughly 9× the typical claim), and its 7 rejected claims averaged ₹1.45 crore each (roughly 39× the typical claim).
In other words, the amount-basis gap here is concentrated in a small number of unusually large claims, not a broad pattern across Shriram’s book — by count, only 1.4% of its claims were repudiated and 0.14% rejected, both unremarkable figures. Notably, Shriram also settled 100% of its paid claims within 30 days of intimation — the fastest of any insurer in this dataset. This is a useful example of why the amount-basis ratio and the count-basis ratio need to be read together, and why a wide gap is a prompt to look closer, not a verdict on its own.
Why Weren’t All Claims Settled? Repudiated vs Rejected vs Pending
CSR tables usually collapse everything that isn’t “paid” into one bucket. IRDAI’s data doesn’t — it separates claims into four outcomes, and the distinction matters for a reader trying to understand why a claim might not be settled:
- Repudiated — the insurer denied the claim, typically because its investigation found non-disclosure or misrepresentation by the policyholder at the time of purchase (e.g., an undisclosed pre-existing condition or habit). This is the category most directly affected by how accurately you fill out your proposal form.
- Rejected — the insurer denied the claim for other reasons, such as the cause of death falling outside what the policy covers.
- Unclaimed — the insurer has approved payment, but the money hasn’t been collected yet, usually because the nominee/beneficiary hasn’t completed the process.
- Pending — still under investigation or processing at the close of the financial year; not yet decided either way.
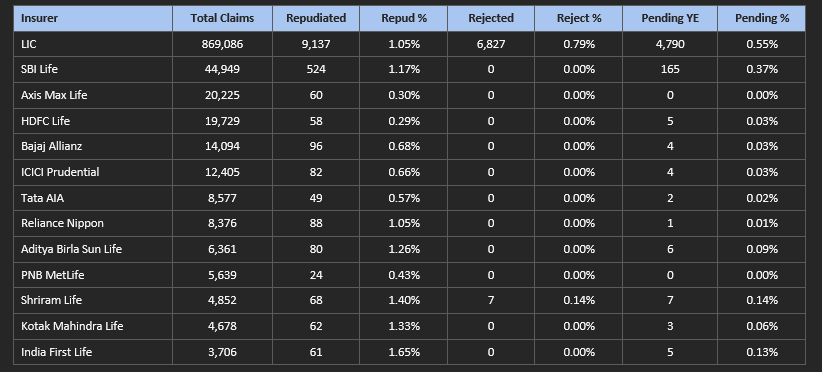
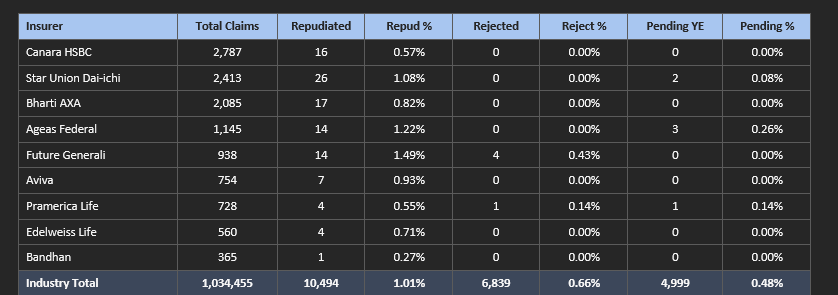
Two patterns stand out: most private insurers report zero or near-zero rejections (as distinct from repudiations) in this table — rejection for reasons outside non-disclosure is genuinely uncommon industry-wide. And repudiation rates cluster tightly between roughly 0.3% and 1.7% for almost every insurer, regardless of size — there’s no insurer in this dataset with an outlier-high repudiation rate by count.
Also Read: ‘No Insurance, No Fuel’: Supreme Court Cracks Down as 56% of Vehicles Run Uninsured
How Fast Do Insurers Actually Settle Claims?
This is a different question from CSR, and IRDAI tracks it separately: of the claims an insurer did pay, how long did it take from intimation to payment? Industry-wide, 97.11% of paid claims were settled within 30 days, and 99.28% within 90 days.
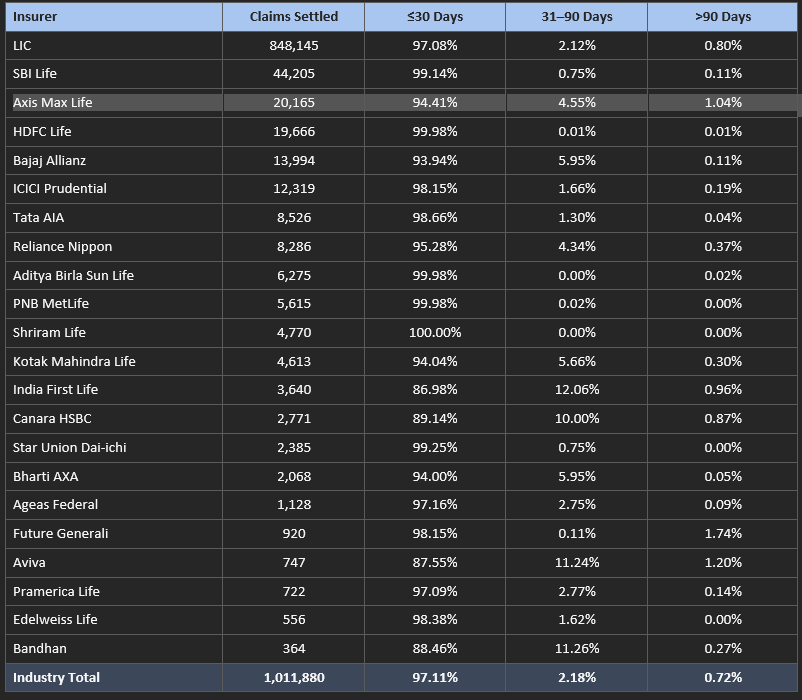
Worth flagging: Bandhan topped the CSR-by-count ranking above (99.73%), but is among the slower insurers on turnaround — only 88.46% of its paid claims were settled within 30 days, with 11.26% taking 31–90 days. India First (86.98%), Aviva (87.55%), and Canara HSBC (89.14%) show a similar pattern. A high CSR doesn’t automatically mean a fast claim experience — they’re genuinely different dimensions of “how good is this insurer at claims,” and it’s worth checking both.
4-Year Trend: How Has Claim Settlement Changed?
Industry-wide figures, FY 2021-22 to FY 2024-25:

The count-basis ratio has drifted down slightly over four years, while the amount-basis ratio has actually improved — the industry is, on balance, settling a slightly smaller share of claims by number but a larger share of the total rupee value owed. The sharp drop in total claim volume between FY21-22 and FY22-23 largely reflects the tail-off of pandemic-linked death claims.
Why Do Claim Settlement Ratios Differ Between Insurers?
A few structural factors, visible directly in this data, explain most of the spread:
- Product mix. Insurers with a large book of small-sum-assured traditional policies (endowment, money-back) tend to process claims faster and more uniformly than those with a heavier mix of high-sum-assured term cover, where underwriting and investigation take longer.
- Scale and vintage. LIC’s enormous claim volume (869,086 claims — 84% of the industry) means its ratio is effectively the industry average by weight of numbers; a newer insurer settling a few hundred claims a year will show more year-to-year swing.
- A small number of large claims can move the amount-basis ratio a lot. As the Shriram case study shows, a handful of high-value repudiations or rejections can create a double-digit gap between the count and amount ratios without reflecting a broad pattern across the insurer’s book.
Frequently Asked Questions
Which life insurer has the highest claim settlement ratio in India?
By count, Bandhan Life (99.73%) and Axis Max Life (99.70%) lead for FY 2024-25 — but Bandhan settled only 365 claims, versus Axis Max Life’s 20,225, making Axis Max Life’s number more statistically robust. Among high-volume insurers (10,000+ claims), HDFC Life (99.68%) and Axis Max Life (99.70%) lead.
Is this the same as the “term insurance claim settlement ratio”?
No. IRDAI’s published CSR covers all individual life products combined. There is no official, separate figure for term insurance alone.
What’s the difference between a repudiated claim and a rejected claim?
Repudiated generally means the insurer’s investigation found non-disclosure or misrepresentation at the time of purchase. Rejected covers other reasons, such as the cause of death falling outside policy coverage. Across the industry, repudiation (1.01%) is more common than rejection (0.66%), and both are small relative to the roughly 98% of claims that get settled.
How quickly do insurers pay out death claims once they’re approved?
Industry-wide, 97.11% of paid claims are settled within 30 days of intimation, and 99.28% within 90 days. A few insurers — India First, Aviva, Canara HSBC, and Bandhan among them — settle noticeably slower than this average even though their overall CSR looks strong.
Is LIC’s claim settlement ratio bad?
Not really — LIC’s 97.59% looks lower than several private insurers, but it processes more claims in a single year than the rest of the industry combined, across a very large, older, and more diverse policy book. Comparing it directly to an insurer settling a few thousand claims isn’t quite apples-to-apples.
Should I choose an insurer purely based on claim settlement ratio?
CSR is one useful data point, not the whole picture. It doesn’t account for claim size, disclosure accuracy at the time of purchase, product mix, or turnaround time. It’s best read alongside amount-basis CSR, settlement speed, and solvency ratio.
How often is this data updated?
Annually. The Handbook on Indian Insurance Statistics for a given financial year is typically published by IRDAI roughly 10-11 months after that financial year ends (the FY 2024-25 edition was released in February 2026).
Claim Settlement Ratio: Does this include health insurance or motor insurance claims?
No. This data is specific to individual life insurance death claims. General and health insurers report claim settlement separately, on a different basis (claims settled within a time window, rather than a single annual ratio).
Claim Settlement Ratio: Sources & Methodology
- Primary source: IRDAI, Handbook on Indian Insurance Statistics 2024-25 — Table 15 (“Individual Death Claims of Life Insurers – Insurer-wise”) and Table 18 (“Duration Wise Settlement of Death Claims – Individual Category”).
- Cross-verified against: IRDAI Annual Report 2024-25 (industry-aggregate figures) and the standalone Handbook on Indian Insurance Statistics 2023-24 (Table 15). All independently matched to two decimal places for FY 2024-25 and FY 2023-24 aggregate figures, with no restatement found between editions.
- Internal consistency checks: For every insurer, Table 18’s “claims settled” total was checked against Table 15’s “claims paid” figure (zero mismatches across 26 insurers), and Table 15’s paid + repudiated + rejected + unclaimed + pending was checked against total claims (zero mismatches).
- Scope: Individual life insurance business only. Group claims (employer/creditor-linked schemes) are reported separately by IRDAI and are not included here.
- Figures are as published by IRDAI; percentages are independently recalculated from the underlying claim counts and amounts in the Handbook, not copied from any secondary or comparison website.
Claim Settlement Ratio: Disclaimer
This article is based on data published by the Insurance Regulatory and Development Authority of India (IRDAI) and is intended for general informational purposes only. It does not constitute financial, insurance, or investment advice, and should not be treated as a recommendation to buy, avoid, or switch any specific insurance policy or insurer.
Claim settlement ratio is one of several factors relevant to choosing an insurer and should be considered alongside product features, premium, solvency ratio, settlement speed, and your own financial needs. Figures reflect data for the financial year(s) stated and are subject to revision or restatement by IRDAI in future publications; readers are encouraged to verify current figures directly on irdai.gov.in before relying on them for any decision. Neither the author nor the publisher accepts liability for decisions made on the basis of this article.