Health Insurance Claim Settlement Ratio Latest: All Insurers, IRDAI Data
Health Insurance Claim Settlement Ratio: IRDAI’s FY25 data shows how often health and general insurers actually paid claims — including how many were settled cashless, and what policyholders complained about. Full company-wise list, explained simply, with all the caveats you need to read it right.

India’s latest health insurance claim settlement Ratio data offers a snapshot of insurer performance. See how insurers compare on claims settled, based on IRDAI data.
Health Insurance Claim Settlement Ratio: If you have ever wondered how often an insurance company actually pays out claims — as opposed to rejecting or delaying them — there is an official number for that. It is called the Claim Settlement Ratio (CSR), and IRDAI (the Insurance Regulatory and Development Authority of India) publishes the raw data behind it every year.
This article breaks down that data for the financial year 2024-25 (April 2024 to March 2025), covering both standalone health insurers and general insurers that also sell health cover. All figures are calculated directly from IRDAI’s own published data, using IRDAI’s own formula — not estimates, and not numbers copied from insurer marketing material.
In short: this article tells you, company by company, what share of claims each insurer actually paid last year, how those claims were actually settled — cashless or reimbursement — and how many policyholders complained along the way. Read on for what these numbers mean, what they don’t tell you, and the full list.
Also Read: Health Insurance Premium: 6 Legal Ways to Cut Costs
Health Insurance Claim Settlement Ratio: What is the Claim Settlement Ratio, in plain language
Think of it this way: every year, an insurer has a pile of claims to deal with — some left over from the previous year, some new. The Claim Settlement Ratio shows what share of claims an insurer approved and paid out during the year out of all the claims it had to process.
CSR = Claims Paid during the year ÷ (Claims pending from before + New claims received during the year) × 100
A higher number means the insurer paid a larger share of what it had to process. This is the same formula IRDAI uses in its own Annual Report, so it is the most standard, apples-to-apples way to compare insurers.
One important thing to know upfront: the ratio does not tell you whether your specific claim will be paid, and it does not measure how fast an insurer pays or how easy the process is. It is one useful signal, not the full picture — more on this below.
Part 1: Standalone Health Insurers — Companies That Sell Only Health, PA & Travel Cover
These are companies whose entire business is health insurance (plus personal accident and travel cover) — they don’t sell car, home, or fire insurance. Because health is essentially their whole business, this data reflects their health-claims performance closely.
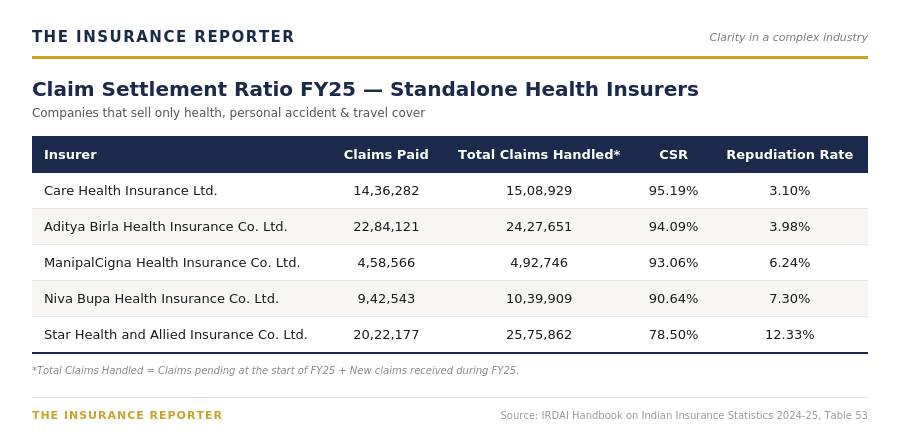
*Total Claims Handled = Claims pending at the start of FY25 + New claims received during FY25.
Three smaller insurers, excluded from ranking: Narayana Health, Galaxy Health, and Reliance Health each handled fewer than 100 claims all year — too few to rank meaningfully.
A note on scope: these companies are also licensed to sell Personal Accident and Travel insurance alongside health. IRDAI’s data doesn’t separate health claims from PA/Travel claims for this table — but based on premium data, PA and Travel make up under 5% of what these companies write, so the numbers above are overwhelmingly a health insurance figure, not a mixed one.
Part 2: General Insurers — Companies That Sell Health Insurance Alongside Motor, Fire & Other Policies
Health Insurance Claim Settlement Ratio: Here is where it gets important to read carefully. Companies like ICICI Lombard, HDFC ERGO, Bajaj Allianz, and the public sector general insurers are among the biggest sellers of health insurance in India — too big to leave out of this story. But IRDAI’s claims data for these companies is not broken down by product line.
The numbers below cover everything these companies insure — car accidents, fire damage, health claims, everything — combined into one figure.
This is not a health-insurance-specific number, and it should not be compared to Part 1 above. Think of it as “how good is this company at paying claims in general” rather than “how good is this company at paying health claims.”
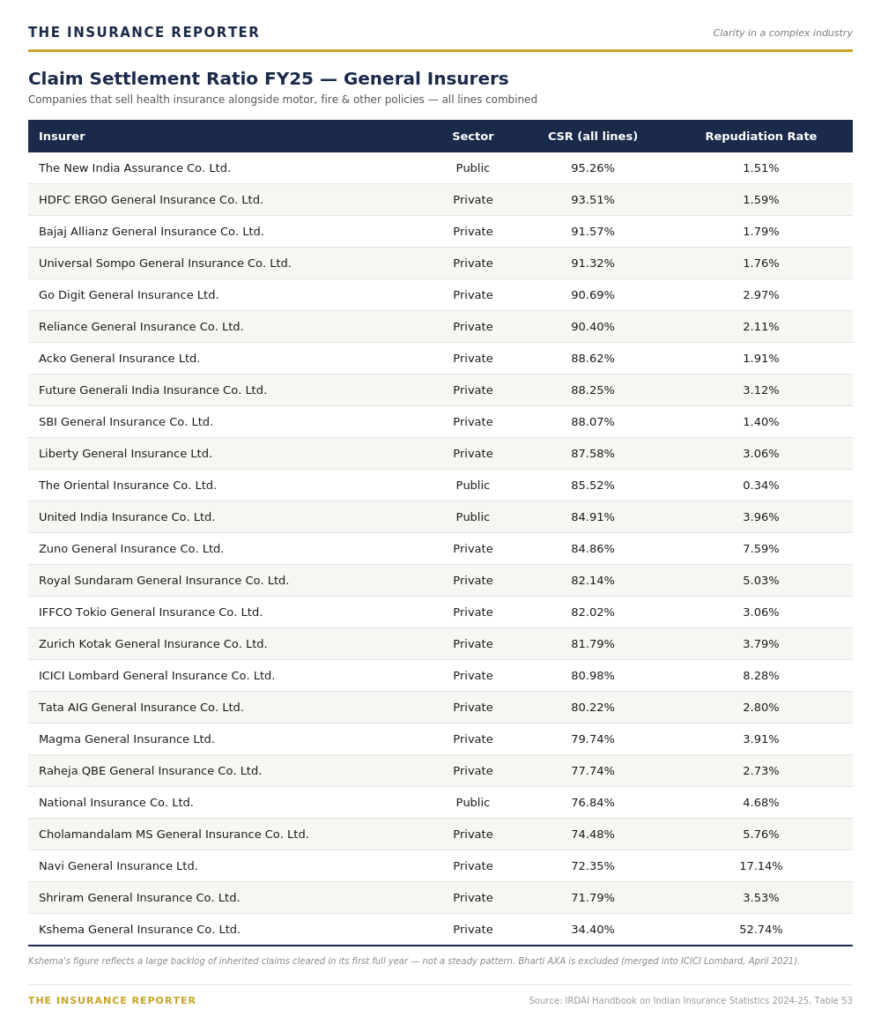
Note on Kshema General Insurance: FY25 was effectively its first full year of claims activity, and its number reflects a large backlog of inherited claims being cleared — not a steady, established pattern like the other insurers on this list.
Note on Bharti AXA General Insurance: its general insurance business was merged into ICICI Lombard in April 2021, and it has reported no data since — it does not appear in this list.
Also Read: Have Corporate Health Insurance? Here’s Why You May Still Need a Personal Policy
Health Insurance Claim Settlement Ratio: How Claims Actually Get Paid: Cashless vs Reimbursement
The CSR tells you whether an insurer pays. A separate set of IRDAI numbers tells you how — specifically, what share of claims were settled cashless (the hospital bills the insurer directly) versus by reimbursement (the policyholder pays first and claims the money back), and who processed the claim.
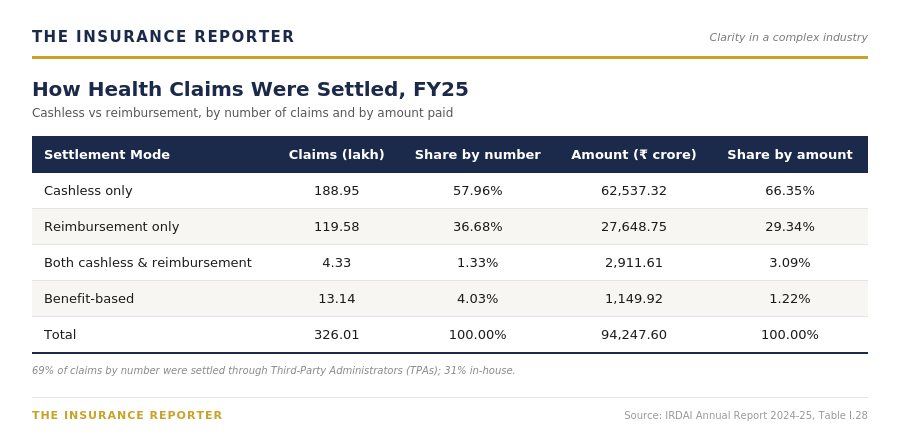
Cashless claims made up 58% of all claims by number but 66% of the total amount paid — meaning cashless claims tend to be for larger hospital bills than reimbursement claims. Working this out from IRDAI’s own figures, the average cashless claim paid out was close to ₹33,100, against close to ₹23,100 for a reimbursement claim.
IRDAI’s data also shows who processes these claims: 69% of claims by number went through a Third-Party Administrator (TPA), with the remaining 31% handled by the insurer’s own in-house claims team.
Health Insurance Claim Settlement Ratio: What Policyholders Complained About
Claims data shows what insurers paid. IRDAI’s grievance data, tracked through its Bima Bharosa portal, shows what went wrong along the way.
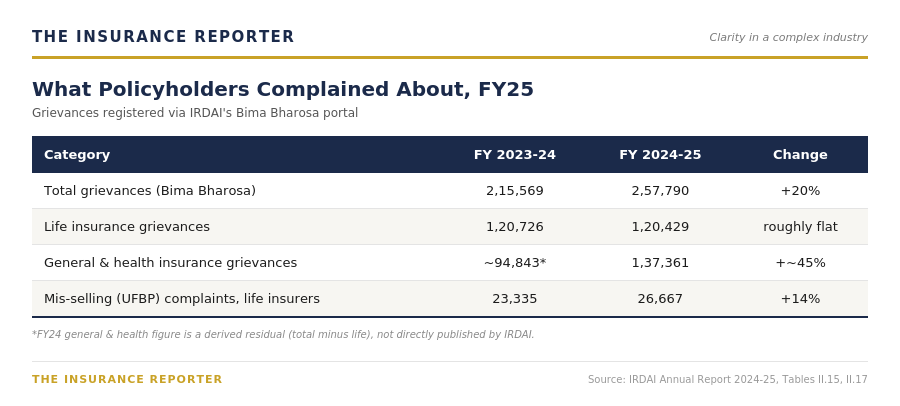
*FY24 general & health figure is a derived residual (total grievances minus life insurance grievances), not a number directly published by IRDAI.
General and health insurance grievances rose by close to 45% in a single year, sharply outpacing life insurance, which stayed roughly flat. About 69% of general and health insurance grievances were specifically about claims — delays, underpayment, or rejection — which is the same territory this article’s CSR numbers cover, just from the policyholder’s side of the desk rather than the insurer’s.
Health Insurance Claim Settlement Ratio: The Big Picture: Industry-Wide Numbers
For context, here is what all health and general insurers combined settled in FY25, per IRDAI’s Annual Report:
- Total health insurance claims handled: 3.73 crore claims, worth ₹1,32,487.81 crore
- Claims paid: 3.26 crore claims (87.50%), worth ₹94,247.60 crore (71.14%)
- Claims repudiated (rejected): 29.51 lakh claims (7.92%)
- Still pending at year-end: 17.07 lakh claims
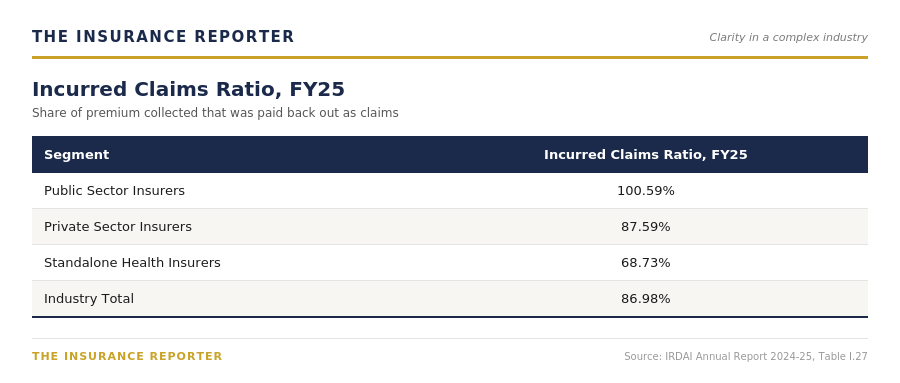
There’s also a related but different number worth knowing — the Incurred Claims Ratio (ICR), which measures what share of the premium an insurer collected was paid back out as claims (not what share of claims it paid):
How to Use This Data If You’re Buying or Renewing Health Insurance
A high CSR is a good sign, but it shouldn’t be the only thing you check. Some practical pointers:
- Look at CSR over a few years, not just one. A single year can be skewed by one-off events (like Kshema’s case above).
- CSR doesn’t tell you about speed. An insurer can eventually pay 95% of claims but still take much longer than another insurer to do it.
- Check the product you’re actually buying. A company’s overall CSR (especially in Part 2’s table) blends products you may never use.
- A cashless claim isn’t automatic — 41% of claims by number were still settled by reimbursement in FY25. Ask about your city’s network hospitals, and read the policy wording on waiting periods and exclusions — these affect your real-world experience more than the headline ratio.
Health Insurance Claim Settlement Ratio: Disclaimers
- CSR and ICR are different measures — CSR is the share of claims paid; ICR is the share of premium paid out as claims.
- Part 1 (SAHIs) is almost entirely health insurance; Part 2 (general insurers) covers all their business lines combined, not health alone. The two tables are not comparable to each other.
- Numbers here follow IRDAI’s own formula, including claims pending from the previous year — so they may differ from figures published by insurers or comparison websites, which sometimes use narrower formulas. CSR also does not capture the full claims experience, including processing speed or grievance rates.
- Grievance figures cover all complaint categories logged on Bima Bharosa, not only claims-related ones, except where noted.
Source: IRDAI Handbook on Indian Insurance Statistics 2024-25 (Table 53); IRDAI Annual Report 2024-25 (Tables I.27, I.28, I.29, II.15, II.17).